2.9.16
Coherent GT
A modern user interface library for games
Coherent GT's asynchronous mode defers most calls to the library to another thread. This makes your UI run with almost no overhead to your main loop. You need to make sure you understand the consequences of multithreading as this can introduce race conditions. Refer to this page for more details.
As of Coherent GT 1.2 you can run all JavaScript, style, layout and rendering command recording in a worker thread. This effectively removes all UI overhead from the main thread of the application. You should always strive to have good performance with the async API also. The Advance() and Layout() calls will stall if the previous calls haven't finished on the worker thread in order not to desync the UI and the application. If the UI work is more than the whole frame of the game, it will stall.
Since GT 1.8.5 the default styles used in pages are split in two categories - a "core" subset that is always included and an "additional" one that contains scrollbar styles. The inclusion of "additional" styles is controlled through the Coherent::UIGT::ViewInfo::EnableAdditionalDefaultStyles option. The additional styles incur a performance penalty as they apply scrollbar styles on all elements in the page. We advise disabling those styles and manually styling scrollbars in CSS only on elements that really will need them.
Do not do:
::-webkit-scrollbar { // applied on all elements - BADwidth: 12px}
Instead do:
.MyScrolledElement::-webkit-scrollbar { // applied only on elements with specific class - GOODwidth: 12px}
In the cases where you don't have control over the page - like when showing content off the Internet, you can still enable the additional styles and scrollbars through EnableAdditionalDefaultStyles.
Coherent GT includes powerful tools and APIs to help developers measure its performance impact on the application and eventually optimize the UI content. Coherent GT aims to occupy a maximum of 10% of the frame budget, which for a 60 FPS title equals to ~1.6ms per-frame.
If you feel that Coherent GT is taking more time than the per-frame budget you’ve allotted to it, or simply want to squeeze more cycles out of it, this guide will show you what to look for and how to optimize your UI.
Note that the numbers in these guide are for reference. They depend on the platform and the architecture of the application you use Coherent GT in. Coherent GT is a product that improves constantly with every version and the performance profile changes accordingly.
Coherent Labs offers a Developer access program that directly connects users to experts from Coherent Labs. We can provide profiling, auditing and ideas in order to get the best out of Coherent GT. Please contact support or your account manager for further information.
The first step is to determine if a performance issue is due to the UI or something else in the application. The easiest way to see this is look for the Coherent GT performance warnings. In development builds (if not disabled in the ViewInfo or SystemSettings), Coherent GT will emit performance warnings when it detects that something is not performing as expected. The performance warnings are printed in the UI log or in Unreal Engine 4 are directly printed on-screen in the Unreal Editor.
Each performance warning will tell you where it is happening and give a clue where to look for when optimizing. Take for instance the warning related to JS execution times:
"Coherent GT: Performance warning on View 0 JS execution time is high (values is in ms). Threshold value: 0.75 Detected value: 1.6 URL: coui://MyTestUI/uiresources/hud.html [You can customize this warning]"
This means that there is something in the JS code that is taking too much time. You can use the Coherent GT Debugger to check what is executed in JavaScript. If there are no performance warnings, it is very unlikely that the issue is related to Coherent GT. The threshold values of the warnings are customizable, so you can tune them for your own frame-time budget. Note that the warnings don't cover the GPU time required to draw the UI. To profile GPU time please use advanced GPU debugging tools like the Visual Studio Graphics Analyser, NVidia NSight, AMD GPU Profiler, Intel GPA, Renderdoc etc.
If you have determined that there is a GT operation that is taking too long, you can run an automated "Performance audit" that will help pinpointing sub-optimal elements or code. Coherent GT can automatically analyse your current UI and report what might be optimized. Please run the automated "Performance audit" and re-check the performance after you've followed the instructions provided by it. See the Page Auditing chapter in the main documentation file for information on how to run the audit.
Note: if you are using UE4 the Auditor can be launched via Coherent GT -> Launch Performance Auditor in the editor.
Coherent GT supports naming GPU texture resources with debug information. The Coherent::UIGT::SystemSettings::SetRenderingResourcesDebugNames flag will force GT to send to the renderer backend names of GPU resources. In the supplied DirectX 11 backend, the SetPrivateData method is used to annotate the debug names and they will be visible in tools like the Visual Studio Graphics Debugger and PIX. Developers can extent the functionality by changing the implementation of the RendererBackend::SetDebugName family of methods.
When deeper information is needed when profiling, we can use the bundled Coherent GT Debugger. The Debugger is available in the package and can be used to connect to a live UI, debug UI, profile and check all elements within the DOM. The Debugger uses the same UI as the WebKit Inspector, which is a well-known tool to all web developers. On a guide how to start the Debugger, please refer to the "UIDebugging" chapter of the Documentation. In Unreal Engine 4, just use the Coherent GT Menu and click "Launch Debugger".
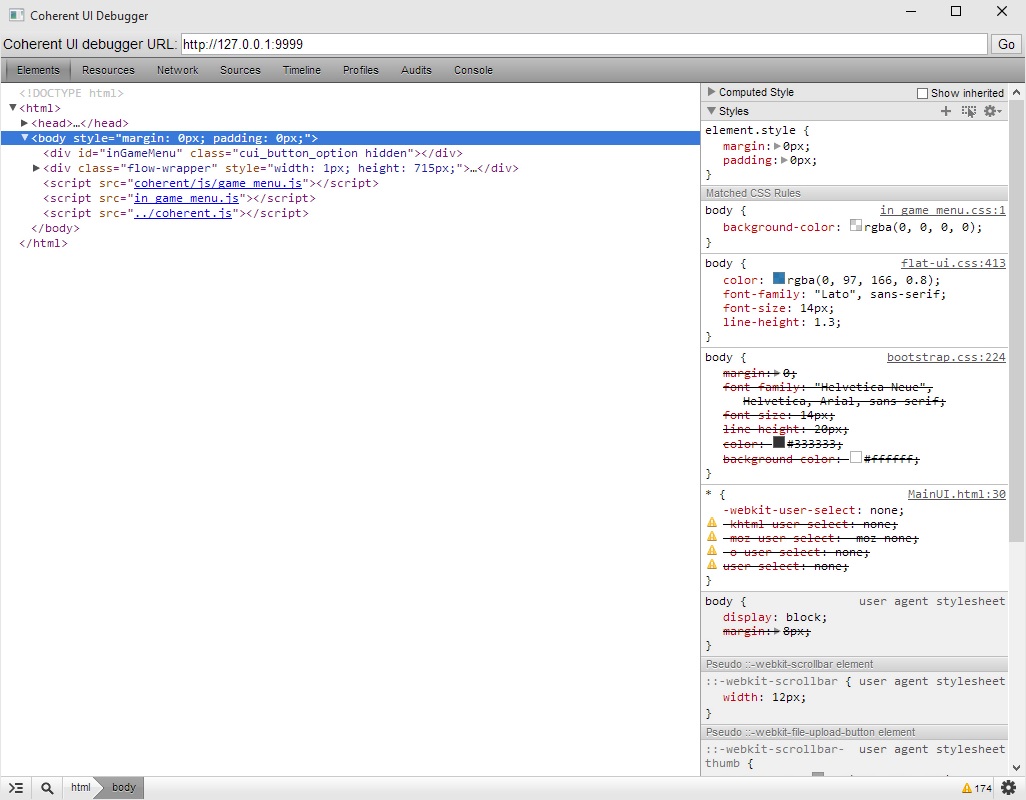
This image shows the "Elements" tab of the Debugger. It can be used for live-editing all CSS properties. If you think that a bottleneck is rooted in style/layout or painting, you can delete all elements in the UI and see what impact that will have on frame-rate. Press "Ctrl-Z" to undo the delete and restore your UI.
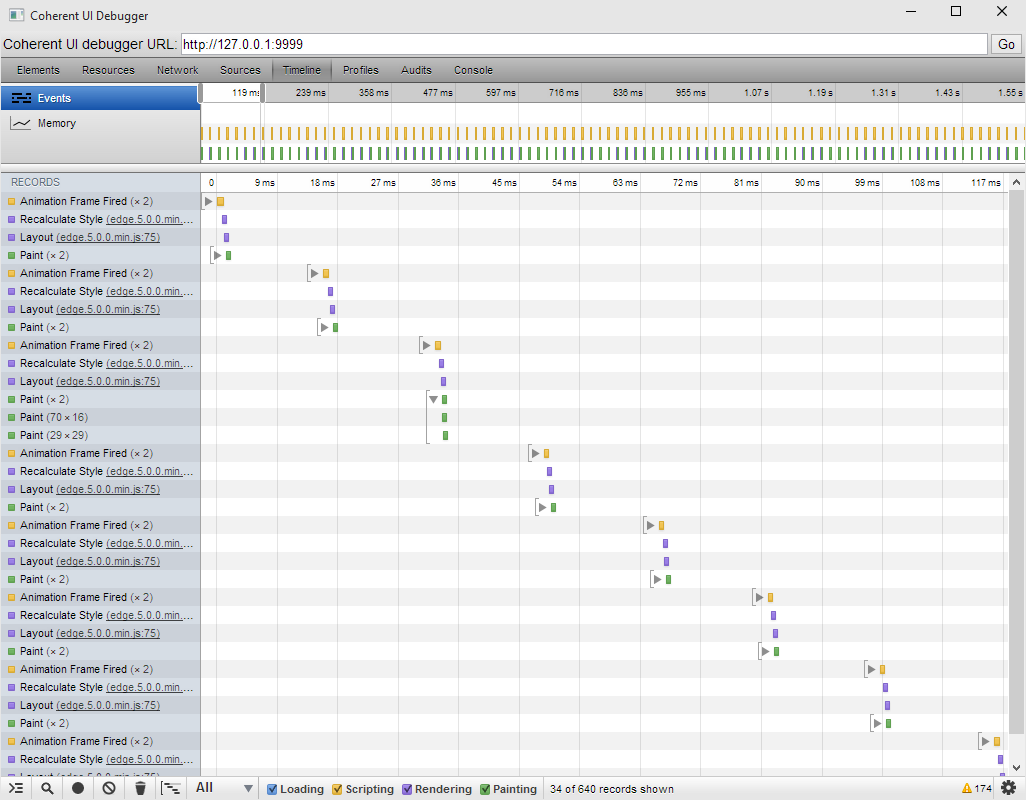
The most important performance-related feature of the Debugger is the Timeline. It shows exact timings of all operations taking place within the UI. Just click the "Record" button (the grey dot in the bottom-left) and collect as much data as needed.
Important events include:
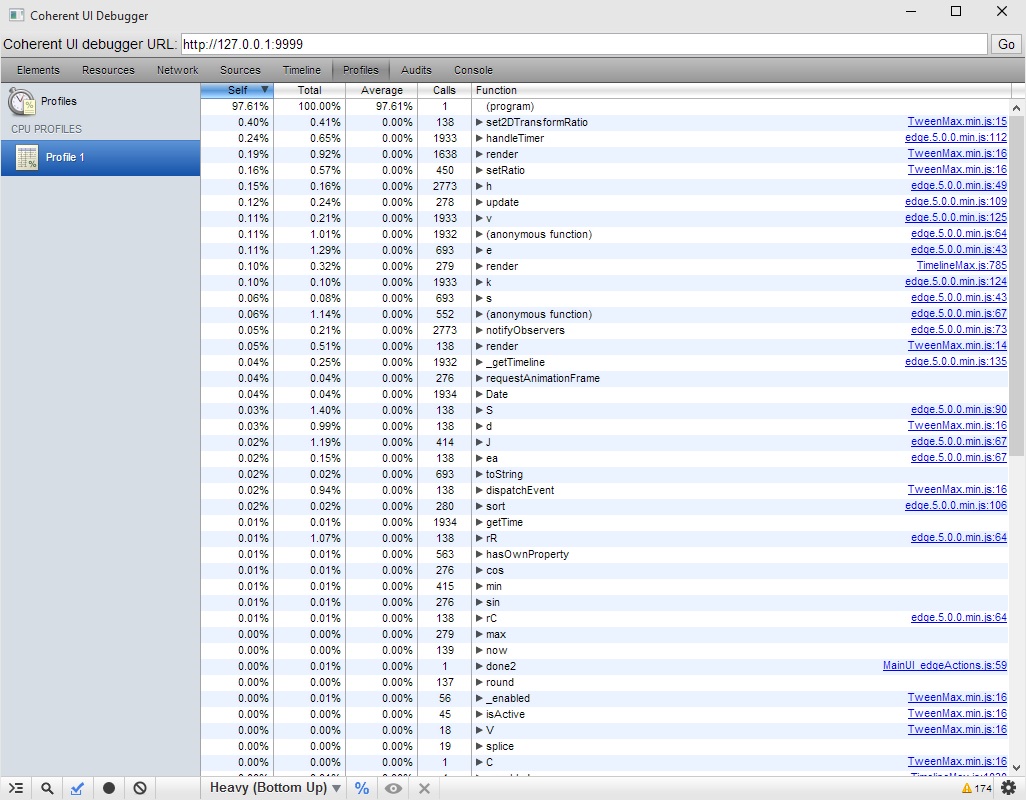
The "Profiles" tab allows to run JavaScript profiling that will show how much time individual JS functions take. It can be used to quickly find bottlenecks in JS code.
Start the Debugger and capture in the Timeline some frames where you experience sub-optimal performance. Now in the Timeline you can see how much time each event took. There are several usual outcomes from this operation.
There are several reasons that can cause JS code to under-perform. As a general rule JS code is slower than native code. Try to execute minimal JS to drive the UI and move calculations and logic to native code. Run a profile of the JS code from the "Profiles" tab. This could give you an idea where a bottleneck in code lies.
Some libraries animate though JavaScript code and that can lead to performance degradations. Avoid at all costs jQuery animations.
If you are using Edge Animate, avoid having too many animations running simultaneously (10+).
The best solution is moving to CSS-based animations (http://www.w3schools.com/css/css3_animations.asp). CSS animations are fully evaluated in C++ and are an order of magnitude faster than JavaScript-based ones. Especially for simple and repeating animations, move them to CSS. You can do this keeping your Edge Animate work-flow and continue to use your stages and symbols.
First check that a maximum of only one layout and style re-calculation is done per-frame. Some JS libraries force in-line re-layouts that degrade performance.
Try to limit the subset of elements that have to be re-laid out. There are several simple techniques that allow you to do that:
Limit the DOM elements count. The more elements you have, the slower a full layout will take. as a general rule 150-200 DOM elements are usually more than enough for very complex UI. To see the DOM elements count, run this line in the Debugger console 'document.getElementsByTagName("*")'.
Use the Timeline to see which parts of the screen are re-painted. You can see what is getting redrawn each frame by using the Debugger, clicking the gear (bottom-right) icon and checking Show Paint Rectangles. Some elements might cause re-draws of parts of the screen by moving over them although they are the only thing that changes.
The best way to reduce paints is to effectively use "Layers". You can promote elements to layers. When an element changes, it will re-draw only it's layer and not other elements that are under or over it. Moving and scaling layers with "-webkit-transform" is essentially a 'free' operation. It will not cause re-layouts or re-paints. The layers will just get composited in a different way.
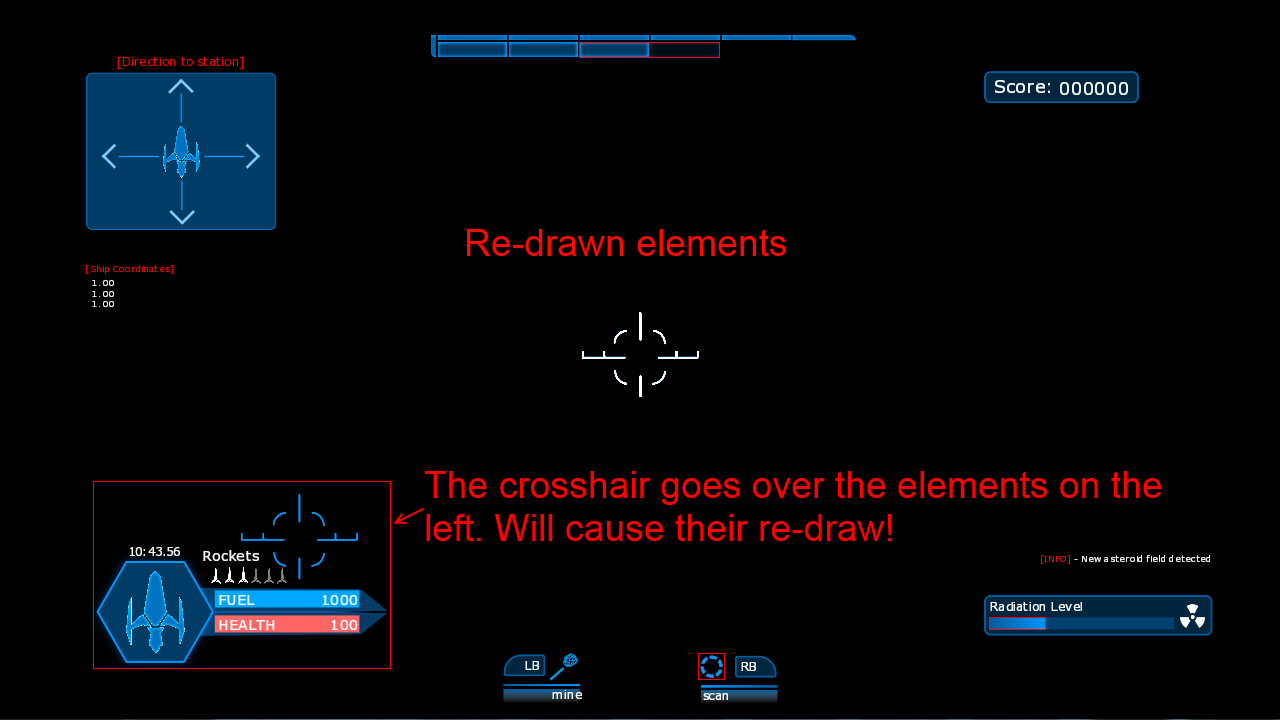
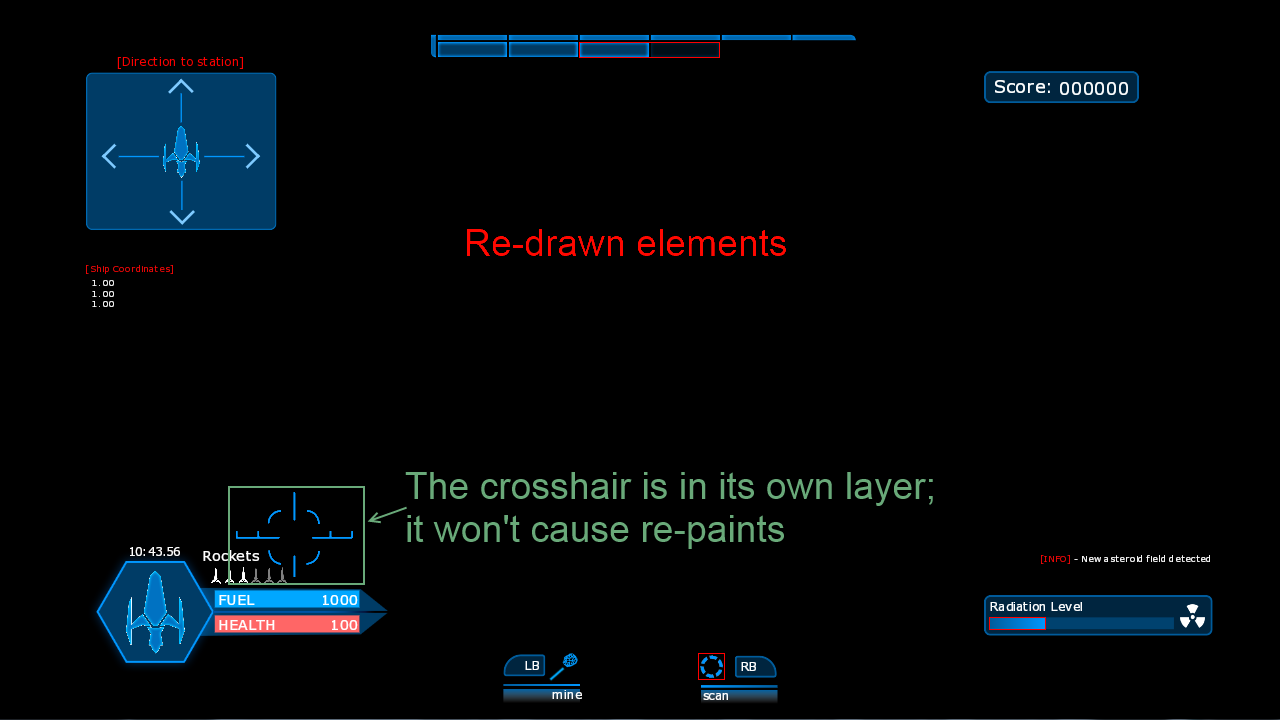
Imagine you have a heavy HUD interface with many elements and a crosshair that moves across all the screen. Without layers, when the crosshair moves over other elements of the View they'll have to be redrawn, even if they are completely static. This can be wasteful and reduce performance. An effective solution is to move the crosshair in its own layer. You can do this by adding a dummy transform: -webkit-transform: rotateX(0deg). Now when the crosshair moves over other elements, they will not be redrawn and performance will be improved.
Please consult the section on layers below in this document.
Note that many or expensive paints will also affect the GPU time of the rendering as they'll often cause more GPU commands to happen.
There is a very simple way to check if a particular element or a hierarchy of elements is slow. Look at your frame-time, connect the Debugger and simply delete this element from the "Elements" tab. Use "Ctrl-Z" to undo the operation and get the element back. If you see a significant change in frame-time, there probably is something sub-optimal in the element.
Removing the element might reduce paints or layouts, in this case try to move it to a layer.
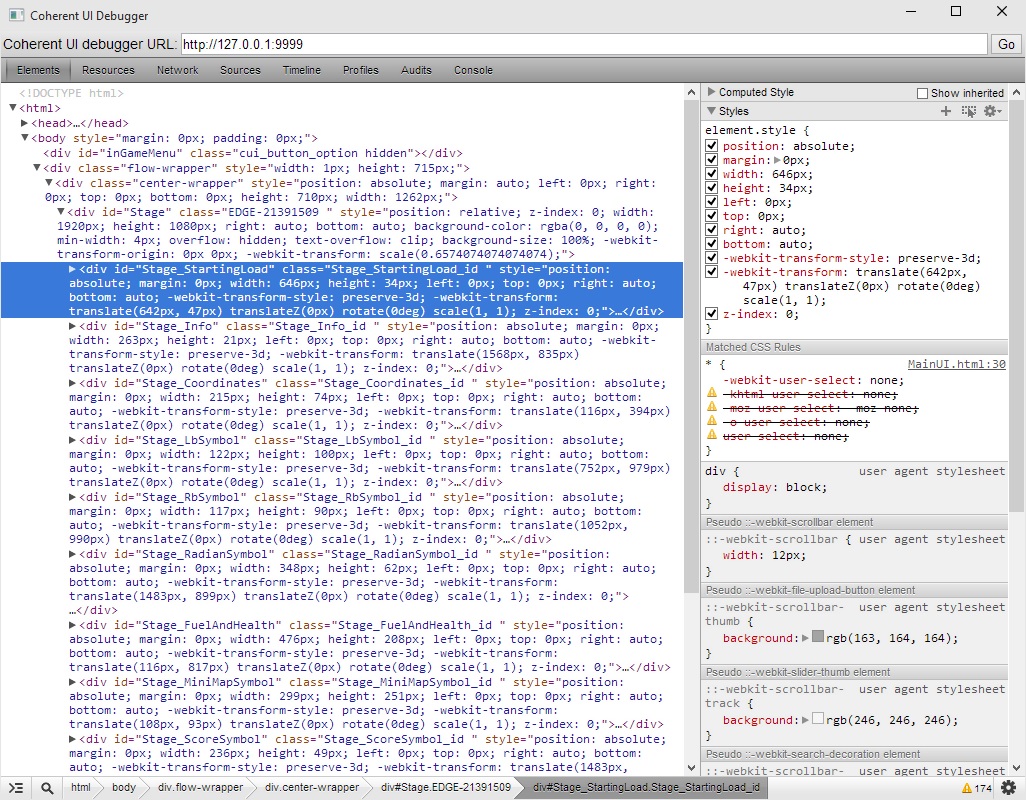
In other cases the element itself (or a descendant) might have CSS properties that are costly to evaluate or render. Elements with shadows are slower to render than elements without. Try removing single CSS properties in the Debugger (in the right pane after you've selected the element) and look for an improvement in frame-time. Please consult the following sections for details on properties that are more costly than others.
Coherent GT allows for easy performance testing through the built-in Debugger support. Use the Timeline feature to check the performance of different parts of your UI - JavaScript execution time, layout times and re-paints.
Coherent GT will emit performance warnings in the file log. You can disable those warnings in the Coherent::UIGT::SystemSettings or per-View in the Coherent::UIGT::ViewInfo structure. You can also change the threshold values that will cause a warning to emit. Warnings help identifying quickly during development that some change has caused a performance drop. You should disable them in shipped products. When you receive a performance warning, you can use the Debugger to profile eventual inefficiencies in the interface and use the information provided in this document to optimize the UI.
In addition to the warnings, Coherent GT can also audit HTML pages and check for suboptimal CSS and HTML usage. See the Rendering chapter in the main documentation file for information how to use them.
show(), hide(), css() functions - use directly the JS element's methods.getElementBy*.html() and text() functions - use directly textContent.requestAnimationFrame is called. Usually this can be set to a value that is much less than the frame-rate of the game. Calling the animation callbacks too often will waste CPU cycles. You can control the animation frame-rate through the Coherent::UIGT::ViewInfo::AnimationFrameDefer member. Set the defer value to the largest possible that looks correct.Coherent::UIGT::View::ShowPaintRects method or using the Debugger, clicking the gear (low-right) icon and checking Show Paint Rectangles.Coherent GT draws the UI using the GPU. It emits Draw Calls to the driver that perform the actual rasterization. Minimizing the Draw Call count is important in order to improve CPU performance. Coherent GT will try to minimize the necessary Draw Calls. Coherent GT can draw both raster images and vector elements. Both have advantages and drawbacks. Raster images are usually faster to draw and require less draw calls but consume memory and are not resolution independent.
Coherent GT employs several caches to accelerate the rendering of the pages. Currently there are 5 caches whose size and content can be controlled by the user:
The following 4 caches are rendering-oriented and their current state can be queried and modified with the Coherent::UIGT::ViewRenderer::GetCacheStats, Coherent::UIGT::ViewRenderer::SetCacheStats; Coherent::UIGT::ViewRenderer::ClearCaches methods.
It might be beneficial to profile and see if some cache is becoming a bottleneck. Usually due to the progressive rendering of the UI there shouldn't be issues with the default sizes, but for instance having dozens of special effects (shadows, blurs, gradients) that are animated simultaneously might require larger caches in a frame sequence.
Vector elements (HTML elements like divs, SVGs) are resolution-independent and will look great under any scaling. Depending on the element they might be more costly to draw. Complex SVG images might require many Draw Calls.
Note that for elements that reside in parts of the screen that don't get re-painted the following guidelines might not apply as they will be drawn just once. Elements that are never redrawn are effectively free per-frame. However if another element moves on-top of a static one - both will get re-drawn. Use the Show Paint Rectangles to inspect the parts of the screen that get re-painted in your UI.
divs. Creating small UI elements from divs is an overkill. Prefer rasters images or SVG. Especially if animated these tiny divs will put pressure on the layout engine.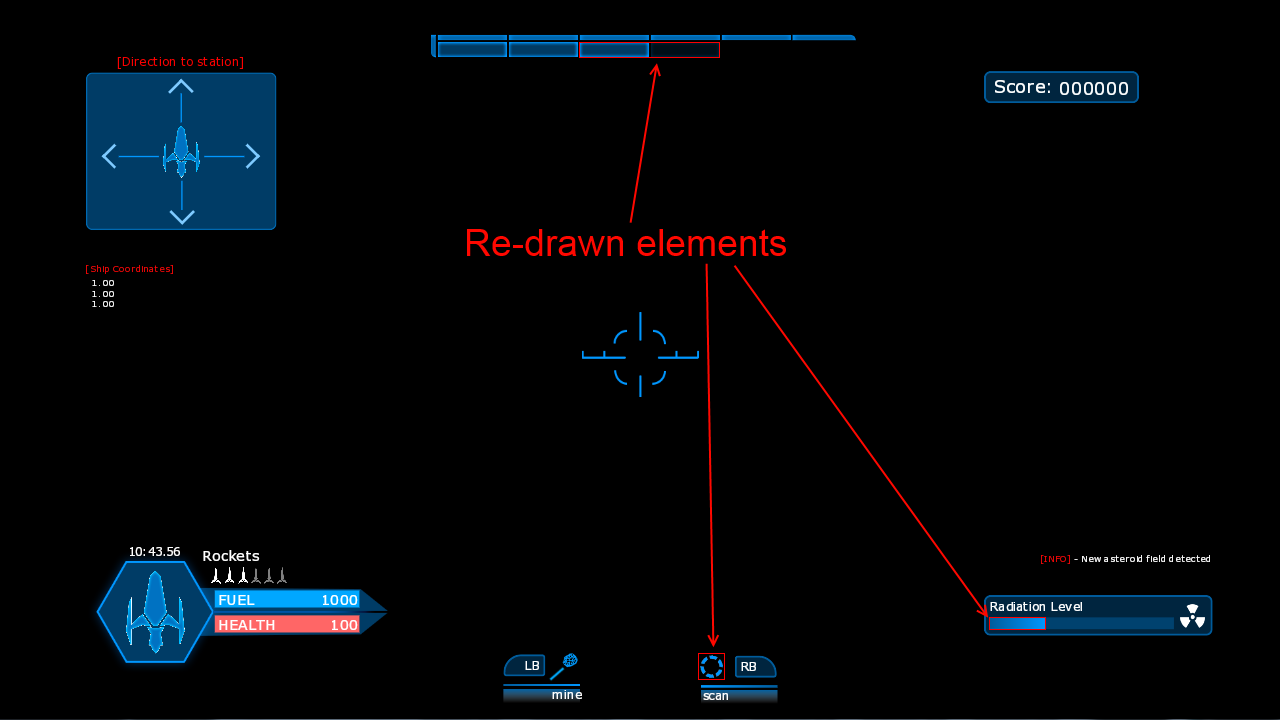
Coherent GT can move certain parts of the page in their own layers. When in the page there are layers we say that the page is in "compositing" mode. Layers can be used to avoid re-paints of heavy elements. Every Element that has some sort of CSS3 3D transform gets its own layer. You can also force Elements to become layered with a dummy transform: -webkit-transform: rotateX(0deg).
NB: In Coherent GT -webkit-transform: translateZ(0px) will NOT cause a new layer to be created. Many tools like Adobe Edge Animate abuse this technique and create layers for every element with a dummy translateZ. In the end this hurts performance. Users are encouraged to create their layers with alternative methods like "-webkit-transform: rotateX(0deg)" if needed.
Imagine you have a heavy HUD interface with many elements and a crosshair that moves across all the screen. Without layers, when the crosshair moves over other elements of the View they'll have to be redrawn, even if they are completely static. This can be wasteful and reduce performance. An effective solution is to move the crosshair in its own layer. You can do this by adding a dummy transform: -webkit-transform: rotateX(0deg). Now when the crosshair moves over other elements, they will not be redrawn and performance will be improved.
-webkit-transform: rotateX(0deg). Do not use the popular -webkit-transform: translateZ(0px).