1.14.0.5
Hummingbird
A modern user interface library for games
Hummingbird remote debugging support is currently a task in active development. The Google Chrome browser is required.
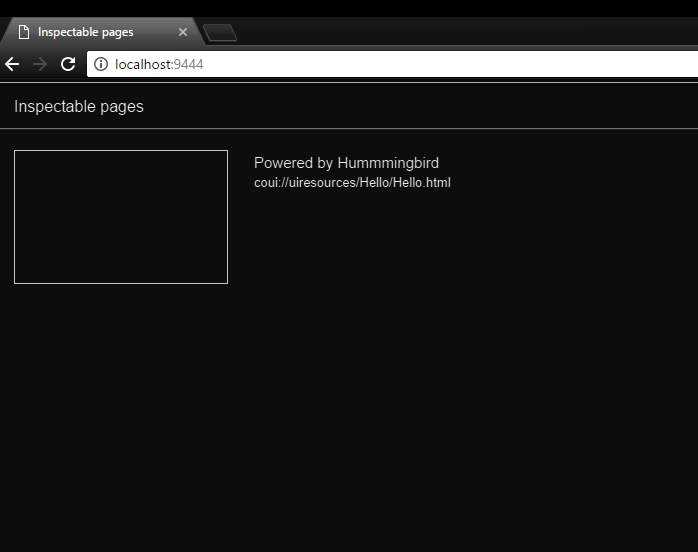
Hummingbird DevTools are based on Google Chrome DevTools. The inspector actually acts the same way as one may expect form the real Google Chrome browser with remote debugging enabled. Among the many advantages of the chosen approach are the many features, the usability and no need to get used to a new GUI if you already have some experience with Google Chrome debugging.
First make sure to properly configure the application using Hummingbird to enable debugging. Configuration is simple - just modify a couple of values SystemSettings (see below), for Android some temporary change the manifest file is needed. From there on the workflow is the same as every JavaScript developer would expect.
cohtml::SystemSettings::DebuggerPort / cohtml::SystemSettings::EnableDebugger to a valid port number and to explicitly enable debugging:cohtml::SystemSettings::DebuggerPort / cohtml::SystemSettings::EnableDebugger to a valid port number and to explicitly enable debugging:cohtml::SystemSettings::DebuggerPort from Google Chrome. This could be localhost:port if Google Chrome is run on the same PC as Hummingbird.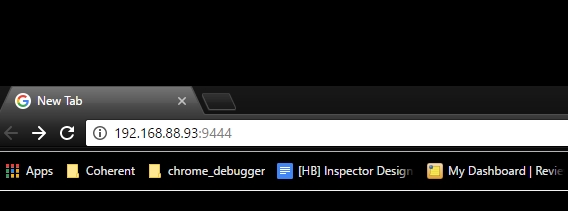
Configuring and using the inspector is similar to Windows. However, there is an exception if you want to use the inspector on the same machine at which the application you want to inspect is running.
On UWP you can't normally connect to the inspector from an application on the same machine due to disabled network loopback. Therefore you have to connect from another IP address. However, if you want run the inspector on the same machine you can run C:\Windows\System32\CheckNetIsolation.exe with the following options:
CheckNetIsolation.exe LoopbackExempt -is -n=AppContainer Name or Package Family Name
The Package Family Name can be found by opening the appxmanifest of the UWP app in Visual Studio and selecting the Packaging tab. This command allows the application to receive inbound connections. It should be left running while you are inspecting the application. For example, to enable the inspector for the UWPCohtml sample on the same machine you have to run the following:
CheckNetIsolation.exe LoopbackExempt -is -n=8df7e036-ff94-4ed5-a2d3-2b2933d4cbf5_36aj8sfe8v5jt
After that you can connect to the PC and port provided in cohtml::SystemSettings::DebuggerPort from Google Chrome.
Workflow is similar to Windows with one difference:
cohtml::SystemSettings::DebuggerPort from Google Chrome, instead of localhost.Everything not mentioned is not supported.
For more information on DevTools usage consult the documentation here.