How do we test performance in Coherent Labs

At Coherent Labs, we care about performance and that should be pretty obvious to anyone that has used one of our products. We strive to get the most out of our code and for that we need proper benchmarking. For anyone interested, I will share some details about our workflow and our new custom data-visualization tool.
This is not a ‘How to properly benchmark code’ type of post, we will only talk about the tools at our disposal.
The setup
The core of our optimization setup is a set of code paths that we know are extremely important for the overall performance such as tight loops and heavy public calls. For example, Coherent::UIGT::View::Layout is one particularly heavy function so it is included in the set. Each of its 3 children – Coherent::UIGT::View::ExecuteJSTimers , Coherent::UIGT::View::LayoutStyles and Coherent::UIGT::View::RecordRenderingComponents are also in this list. A code path gets added to this list if:
- We know that it is important a priori.
- Sample profiling shows the code path as a potential bottleneck.
- We identify and fix a performance problem with the code path so we add it to the set of testables in order to avoid regressions.
We then have a set of HTML pages to stress test the code. Some examples of test pages include animating 500 <div> elements independently or a variant of this snowflake canvas demo.
Every major release and every nightly build is tested against the set of pages and the execution for every code path is recorded until the results stop fluctuating and settle with less 1% error from the average. This removes most of the noise associated with the test. To further reduce noise, we only start recording until the test page itself told us to. For example, the snowflakes demo will start recording only after the first snowflake has reached the bottom of the screen (which guarantees that snowflakes will be similarly distributed across the screen).
Gathering data
So how do we record the data exactly? The minitrace library, created for the WebKit project, is easy to use and integrate and outputs the results in a human readable JSON file. There also is a fancy data-visualizer built inside Google Chrome for this particular type of files (goto chrome://tracing/ to see it).
Given our dependence on the WebKit project for all of our projects it’s no wonder we went with minitrace.
Data visualization
We’ve been using Chrome’s tracing visualizer for a while but it cannot be used for comparison and tracing the history of performance. We made a custom tool that does exactly that – it knows how to fetch the saved data from our master machine, parse it and summarize it to reduce the amount of mental work needed to check whether the new build is better or worse than the previous.
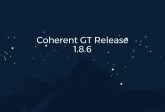
Data overview
The most basic page display a summary of each code path + two charts depicting the execution time per frame. It can be used to get a better sense of how much time does each code path take both relatively to the entire program and relatively to every other code path.
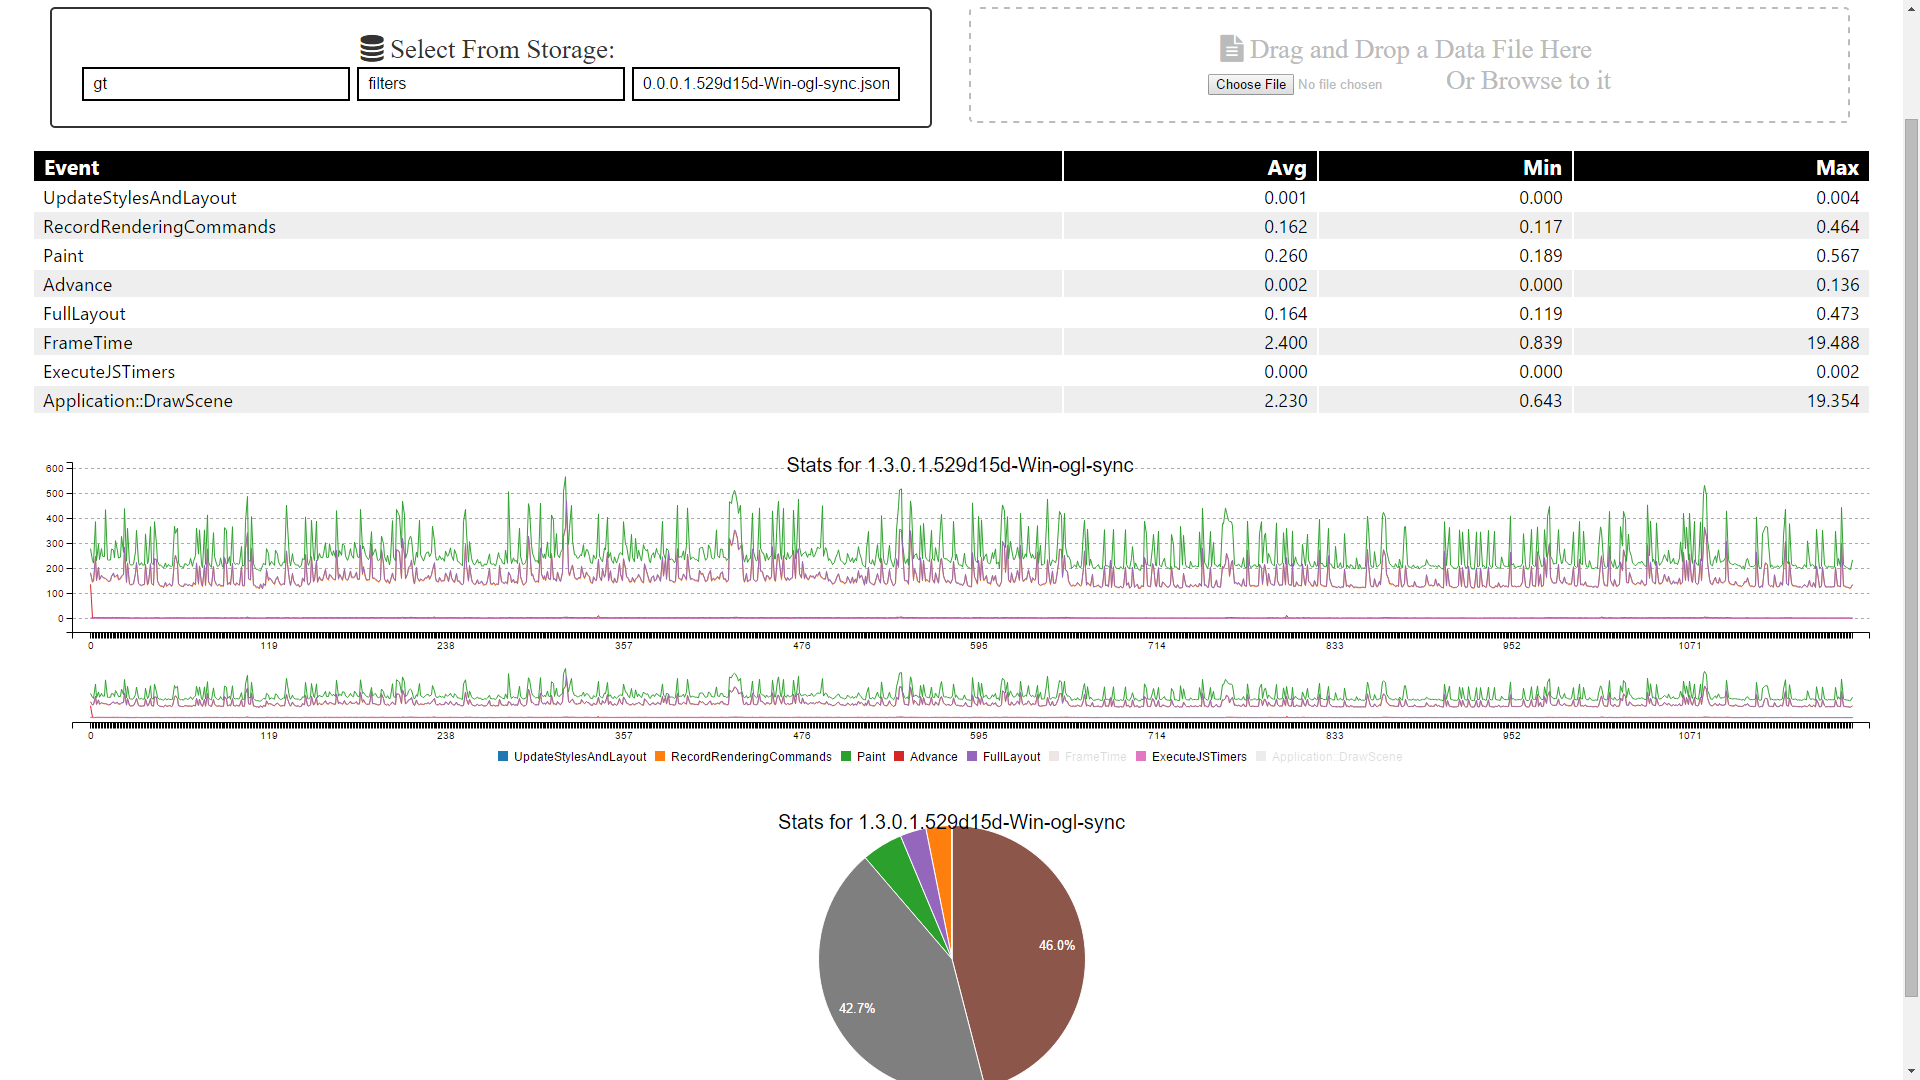
Comparison
This page lets us compare any number of records. By comparing the average values of each code path or looking at their graphs charted simultaneously it is easy to find problems and improvements.
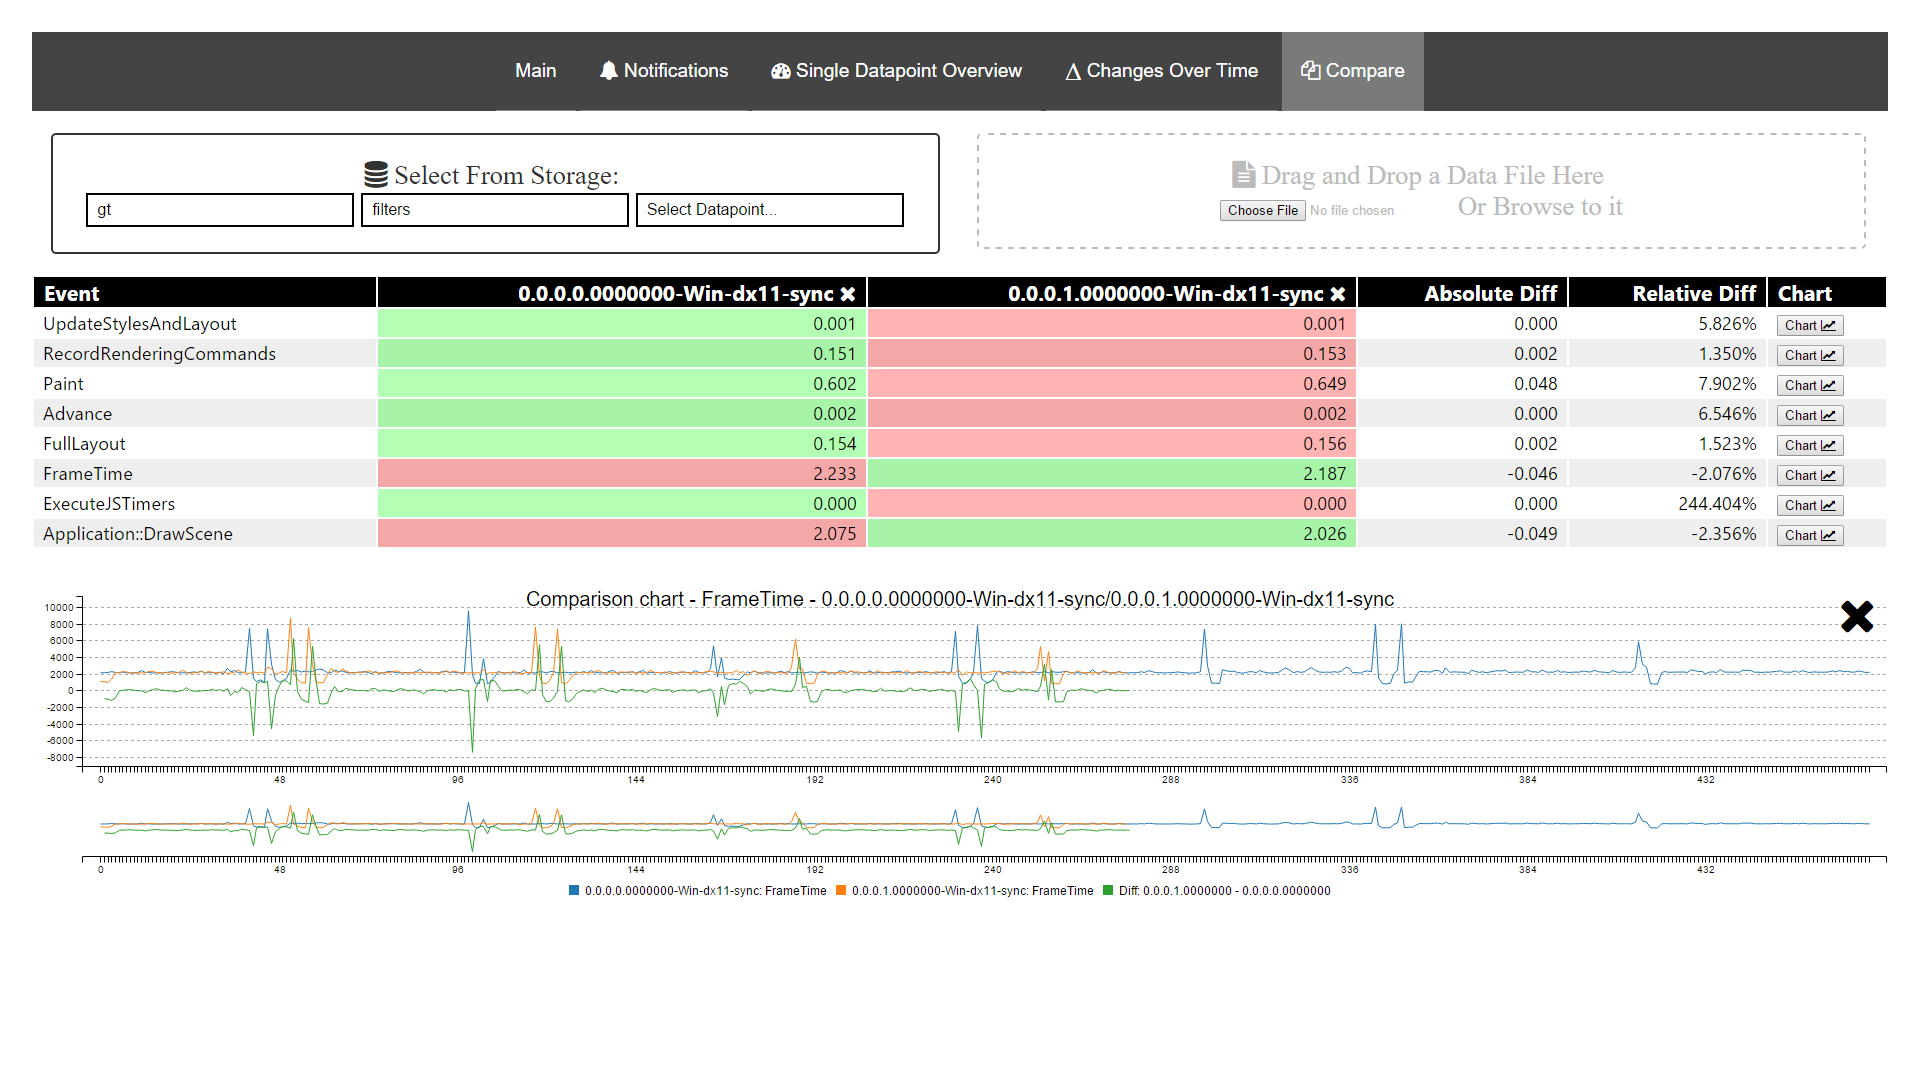
History
This page allows us to see the rate of changes in execution times of our code paths as they evolve over time.
Notifications
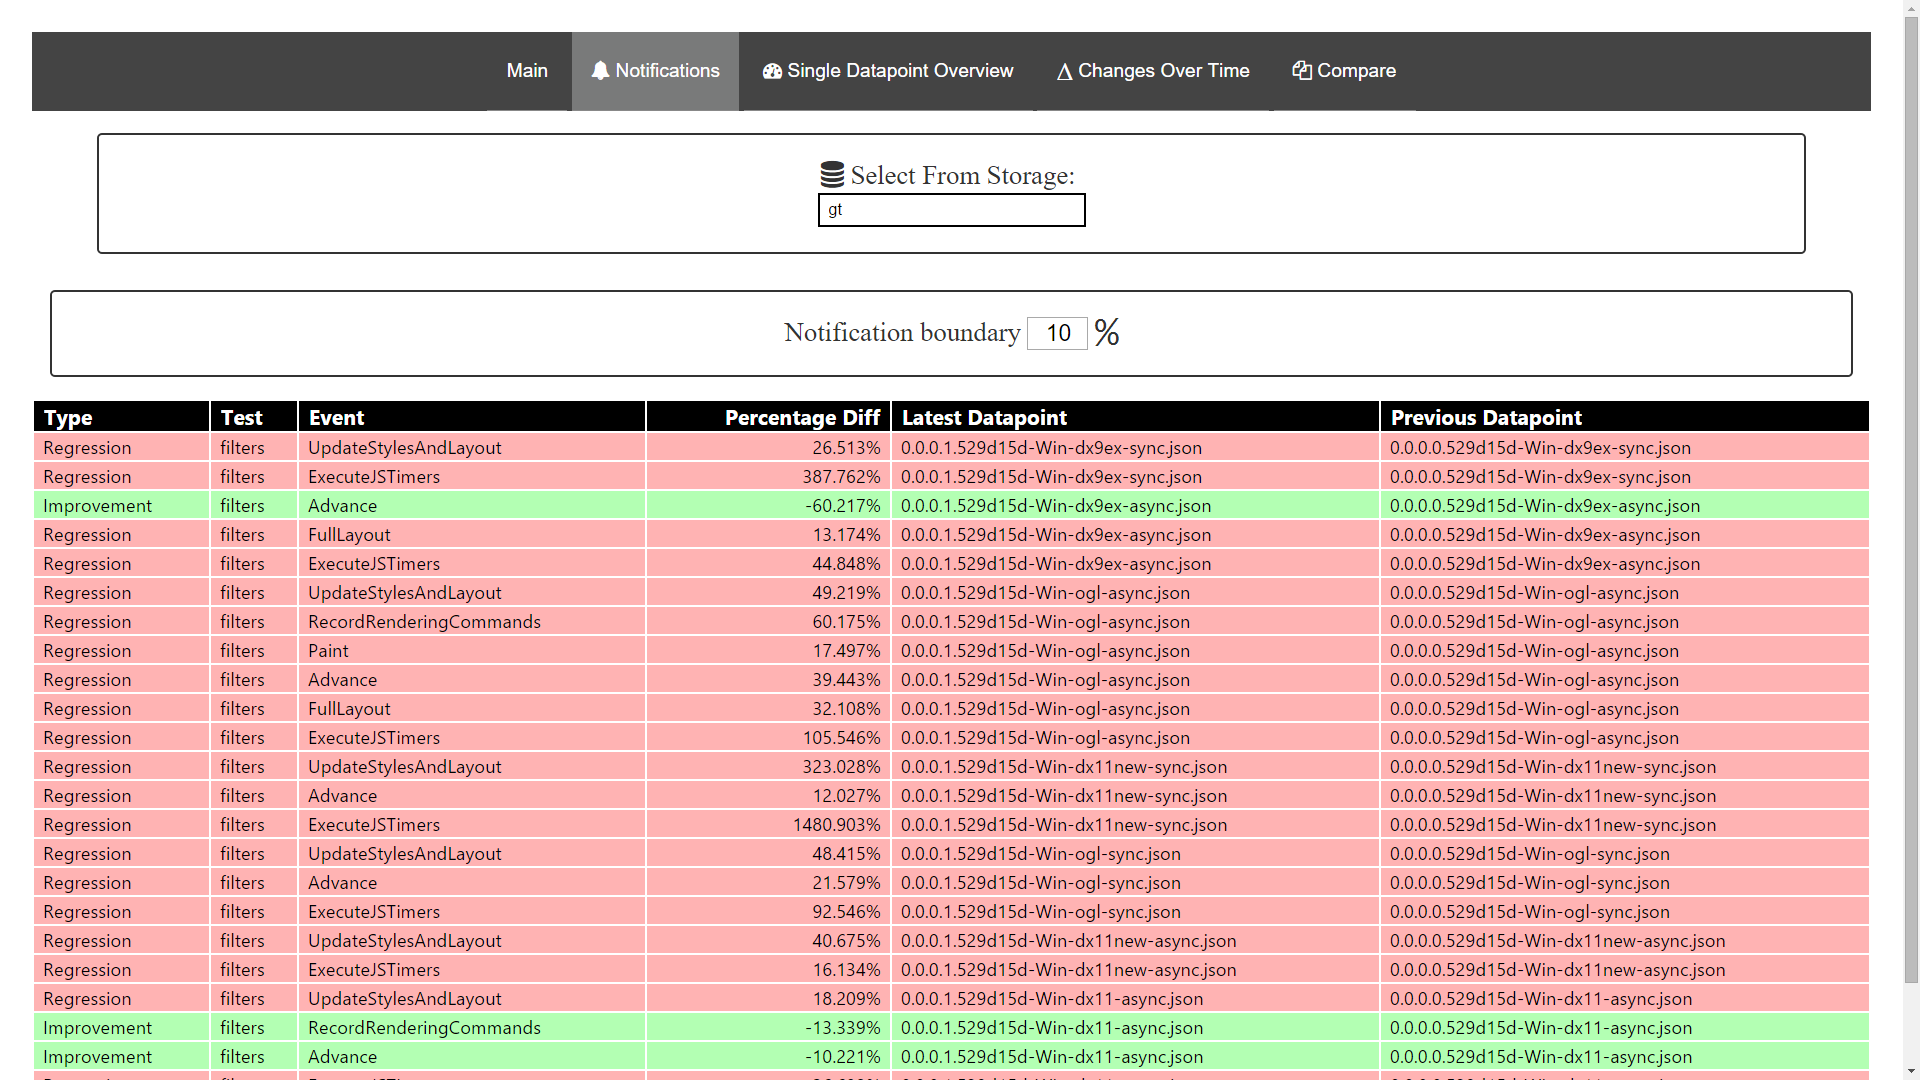
The page eases detection of significant changes in performance by detecting them automatically.
Our experience showed that this system can greatly reduce the amount of mental labor required to do performance testing. Although there are other existing tools (Chrome Tracing, Mozilla’s Perfherder) it really was worth it to build a custom one as integration and setup cost was close to zero plus customization is easily available.
What does your studio use? Do you do handcrafting or do you use readily-available instruments? Share your answers as a comment, on twitter or in the forum.