The new GT Debugger overview

Coherent GT 2.0 supports the whole WebKit Inspector protocol and allows for live viewing, editing and debugging of the UI even when the client application is running. This increases the productivity of UI programmers and designers immensely as they can directly work on the live interface without stopping the game, recompiling or restarting. In this tutorial, we will look at the new features of the GT 2.0 Debugger.
Let’s start with the overview, open a sample with GT 2.0. Open the new Debugger and navigate to port `http://127.0.0.1:19999`.
Тhe Debugger’s navigation bar consists of seven tabs. You can close a tab from its exit button or restore it from the button with the + sign. At the end of the navigation, there is a button that provides quick access to your Debugger settings. Since the Debugger has a completely new look, there are tooltips that appear when you hover over the icons, to help you get used to the new interface easier.
One of the most exciting new features is the ability to open the Debugger in Inspect Element mode by pressing ![]() button or using the shortcut
button or using the shortcut Ctrl + Shift + C. While you are in this mode, hover over an element in the scene. The element will automatically be highlighted in the Elements panel. Click on the element to exit Inspect mode while keeping the element highlighted within the Elements tab.
Now let’s take a look at each one of the tabs.
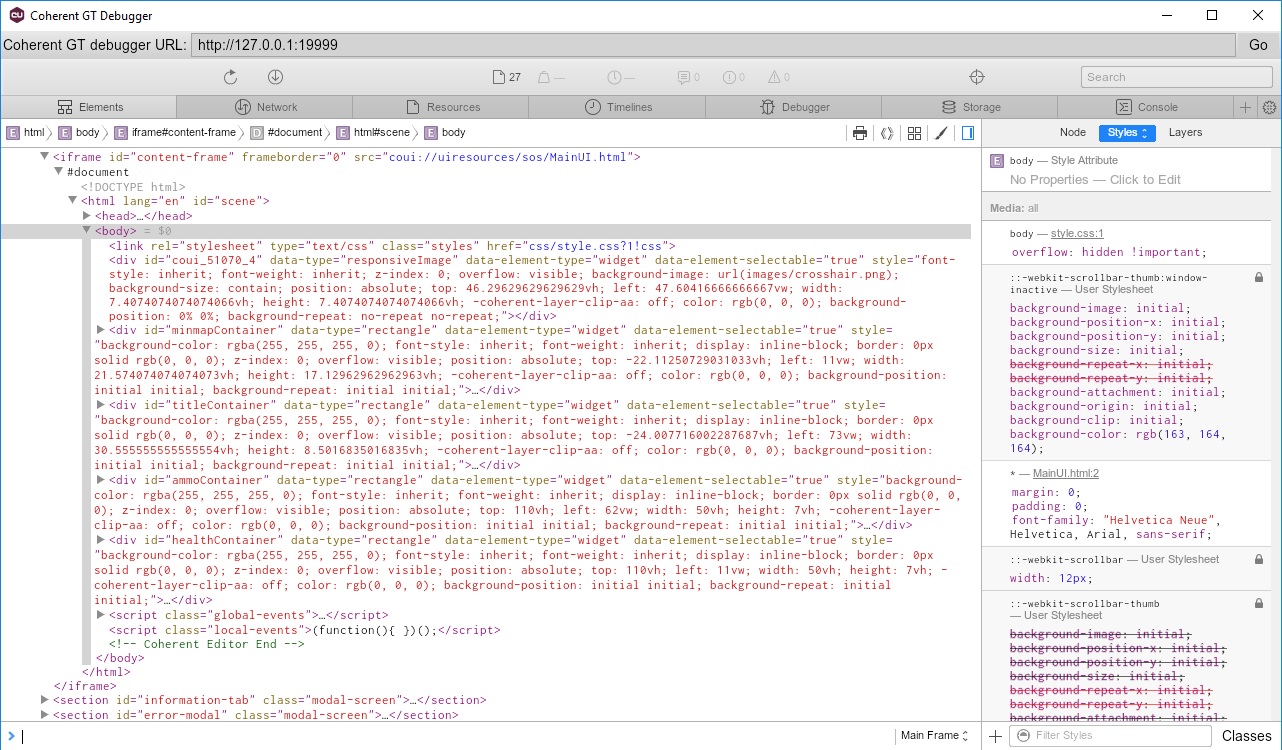
Elements
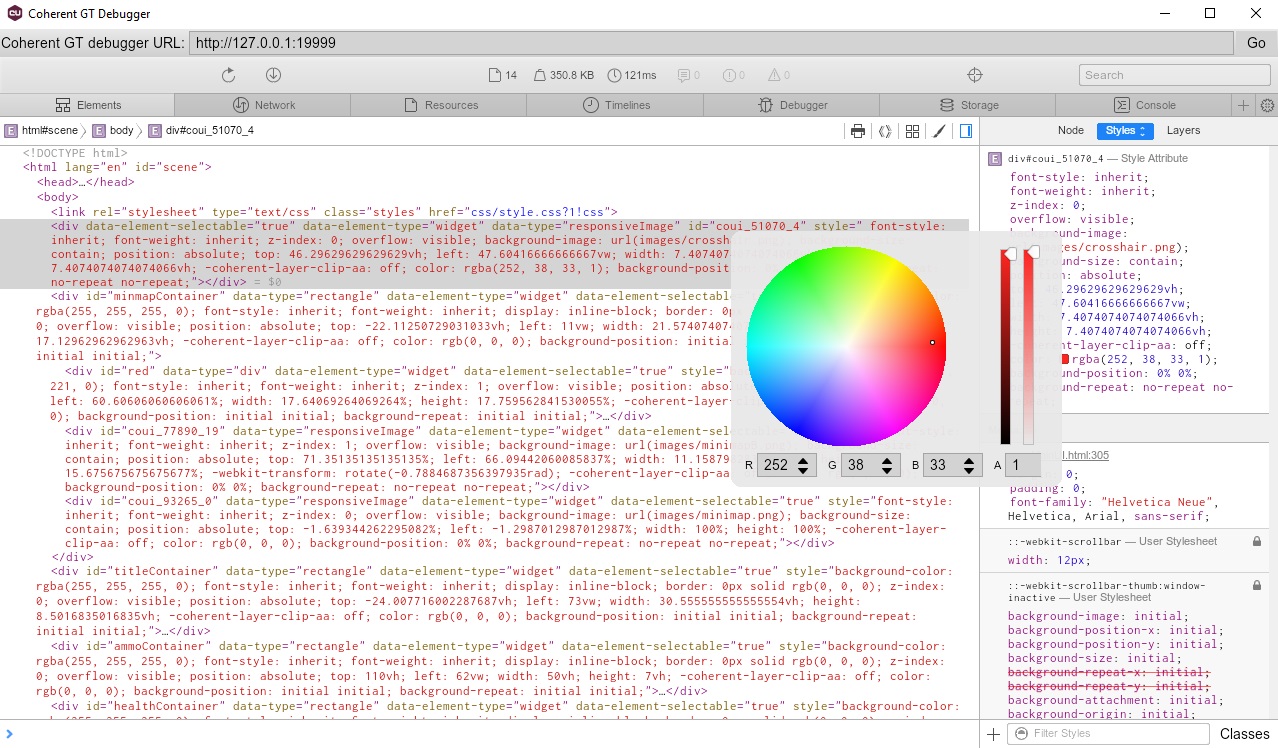
The page with all its current state is shown. You can hover over elements and they will be highlighted in the scene. On the right side of the Debugger, there is a menu that allows you to inspect the DOM nodes, the CSS styles (you can filter the computed styles, the rules or the visual styles) and the Layers. All properties of the elements are editable and changes will be immediately visualized in the live application. If you want to change a DOM element’s color instantly, go to the Styles Rules view and click on the color’s value sample. A color picker popup will appear, enabling you to change the color. It works properly with RGBA, HSLA and HEX values.
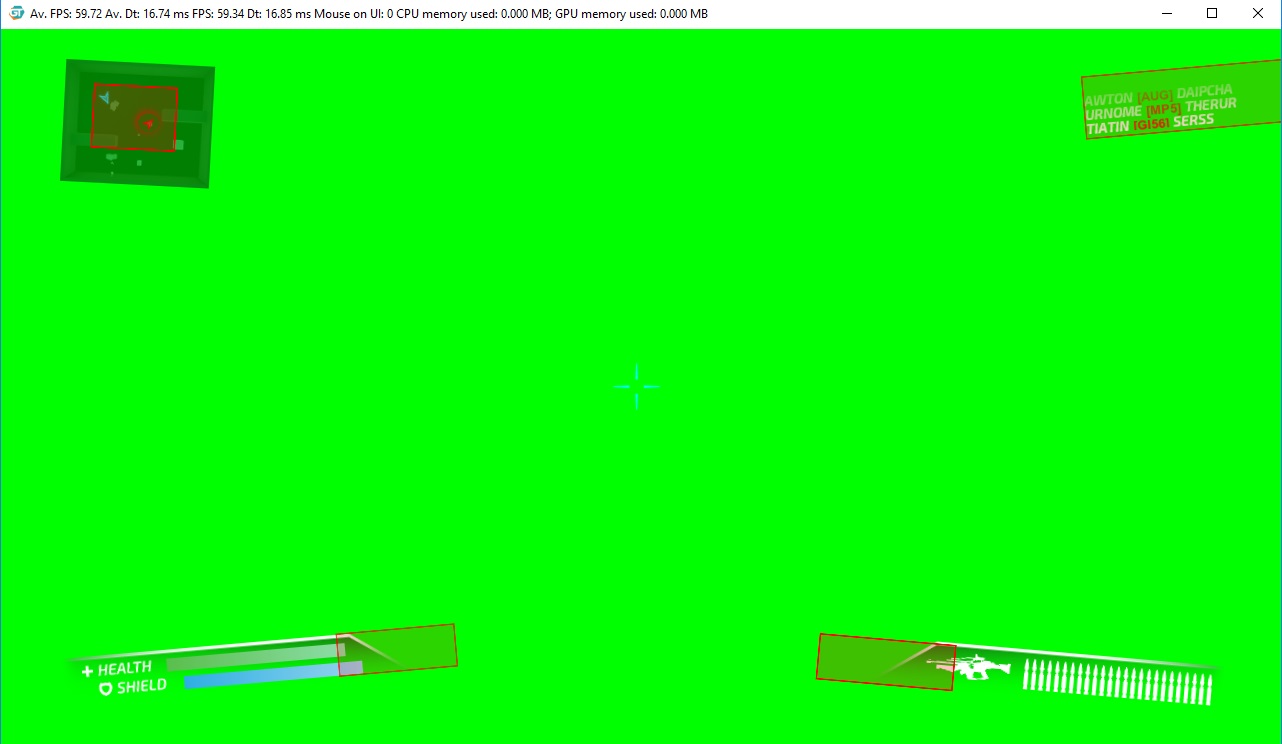
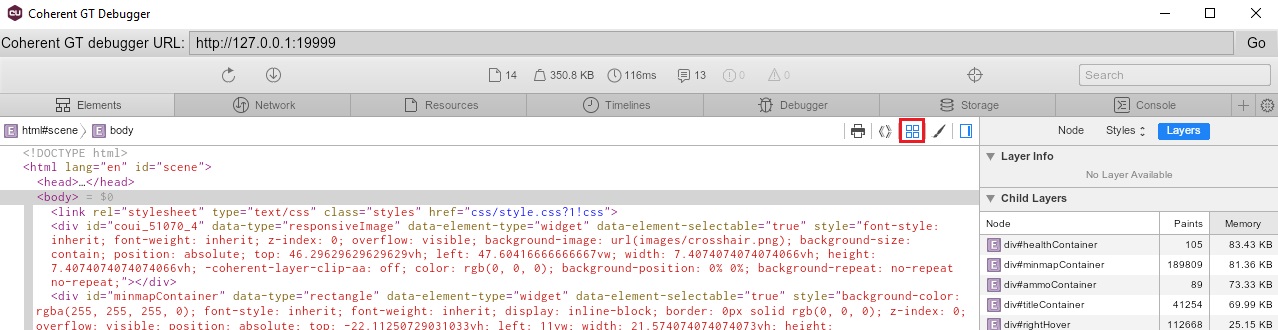
From the Elements tab, you can check what gets re-drawn by pressing the following button (highlighted with red):
Coherent GT re-draws only parts of the View that have changed between frames. It is very important to keep re-drawn regions to the bare minimum. Redundant changes in the DOM like setting CSS styles with tiny differences can cause no visual change but still trigger a re-paint. Users should regularly check the behavior of the page and make sure that no redundant and avoidable re-draws are triggered. With this button you can check visually what gets re-drawn (the elements with red borders):
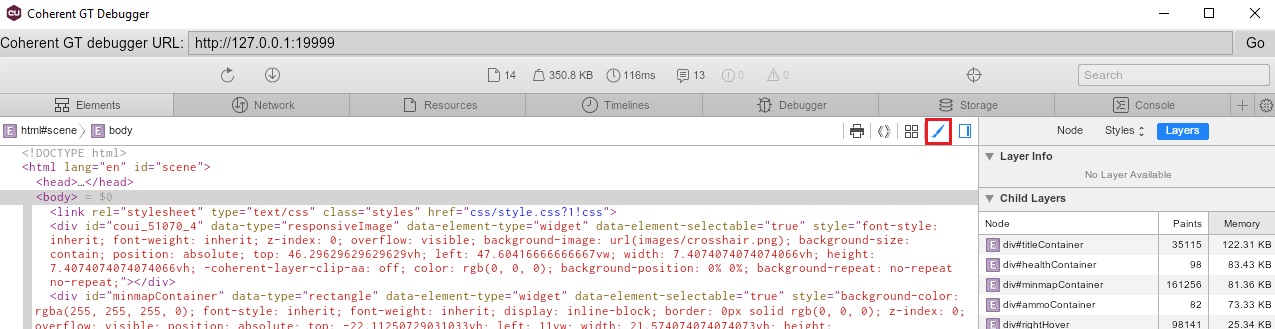
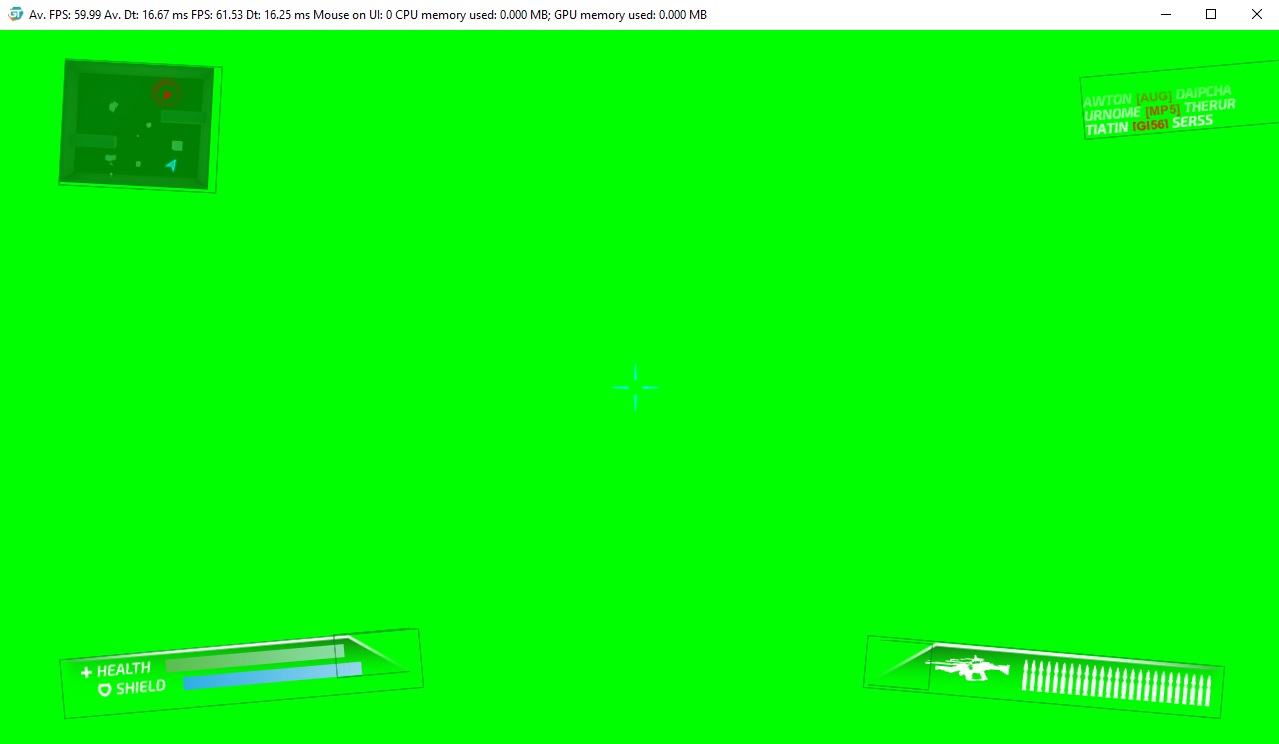
You can also check the UI Layers by pressing the following button (highlighted with red):
Some elements in the page will get their own backing layer (the elements with gray borders):
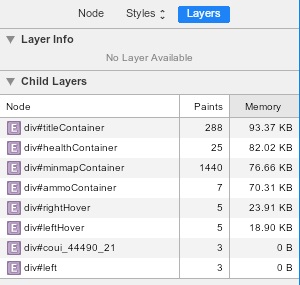
You can see what layers are currently on-screen and their re-paint counters and sizes from the Layers menu on the right:
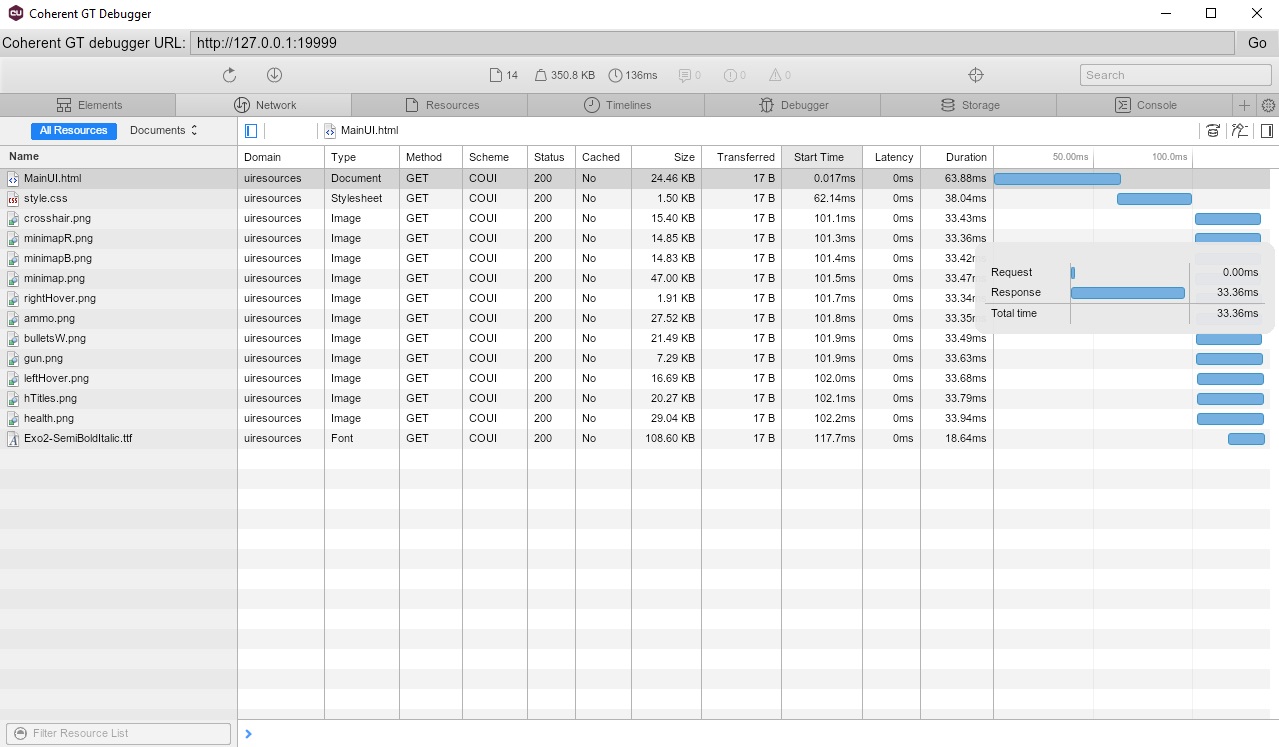
Network
Here you can measure the network performance. This tab records information about each network operation, including detailed timing data, HTTP request and response headers and more. The Requests table displays the following columns:
- Name: The name of the resource (you can filter the resources by type).
- Domain: Domain of the path requested.
- Type: The type of the requested resource.
- Method: The request method used.
- Scheme: The scheme of the path requested.
- Status: The HTTP status code.
- Cached: Whether or not the resource was cached.
- Size: The size of the transferred resource.
- Transferred: The number of bytes that were actually transferred to load the resource.
- Start Time: Sorts by the start time of each network request.
- Latency: Sorts by the time between the start of the request and the beginning of the response.
- Duration: The total duration, from the start of the request to the receipt of the final byte in the response.
- Timeline: A visual breakdown of each request’s activity.
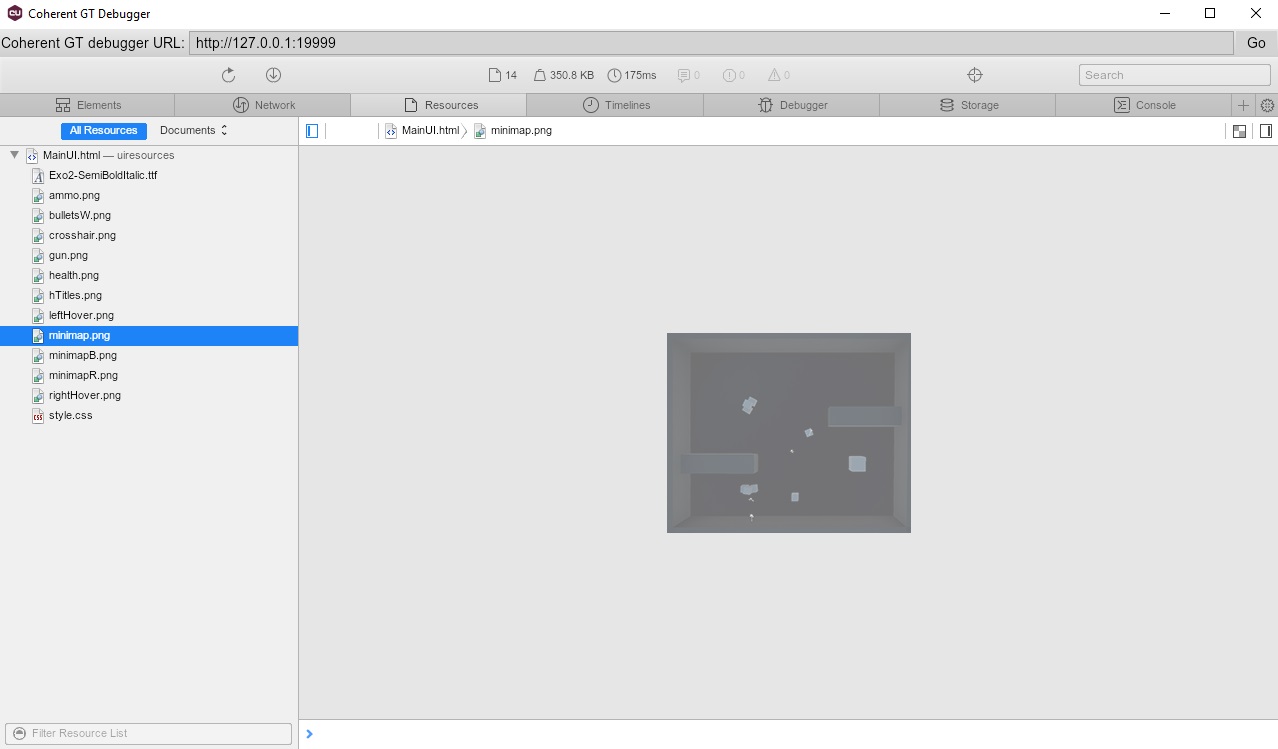
Resources
Lets you inspect resources that are loaded in the inspected page. You can organize resources by stylesheets, scripts, images, or other criteria.
Timelines
Helps you for checking the page performance. You can use the Timelines tab to record and analyze every event that occurred after a page load or a user interaction.
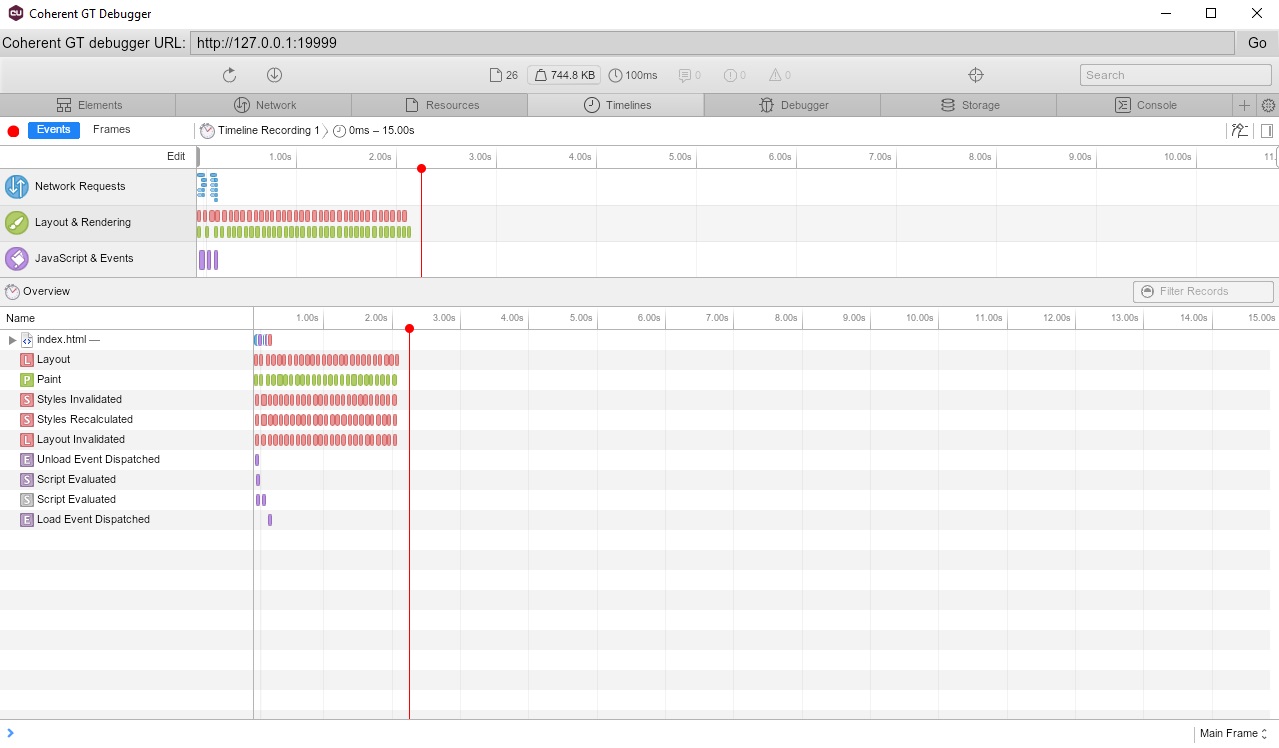
To record the load performance go to Timelines tab and click Reload page button ![]() (shortcut: F5). The Debugger records performance metrics while the page reloads and then automatically stops the recording a couple seconds after the load finishes. The default sections that the Timelines record are Network Requests (represented with blue), Layout & Rendering (represented with red for styles invalidation and recalculation and green for re-paints) and JavaScript & Events (represented with purple).
(shortcut: F5). The Debugger records performance metrics while the page reloads and then automatically stops the recording a couple seconds after the load finishes. The default sections that the Timelines record are Network Requests (represented with blue), Layout & Rendering (represented with red for styles invalidation and recalculation and green for re-paints) and JavaScript & Events (represented with purple).
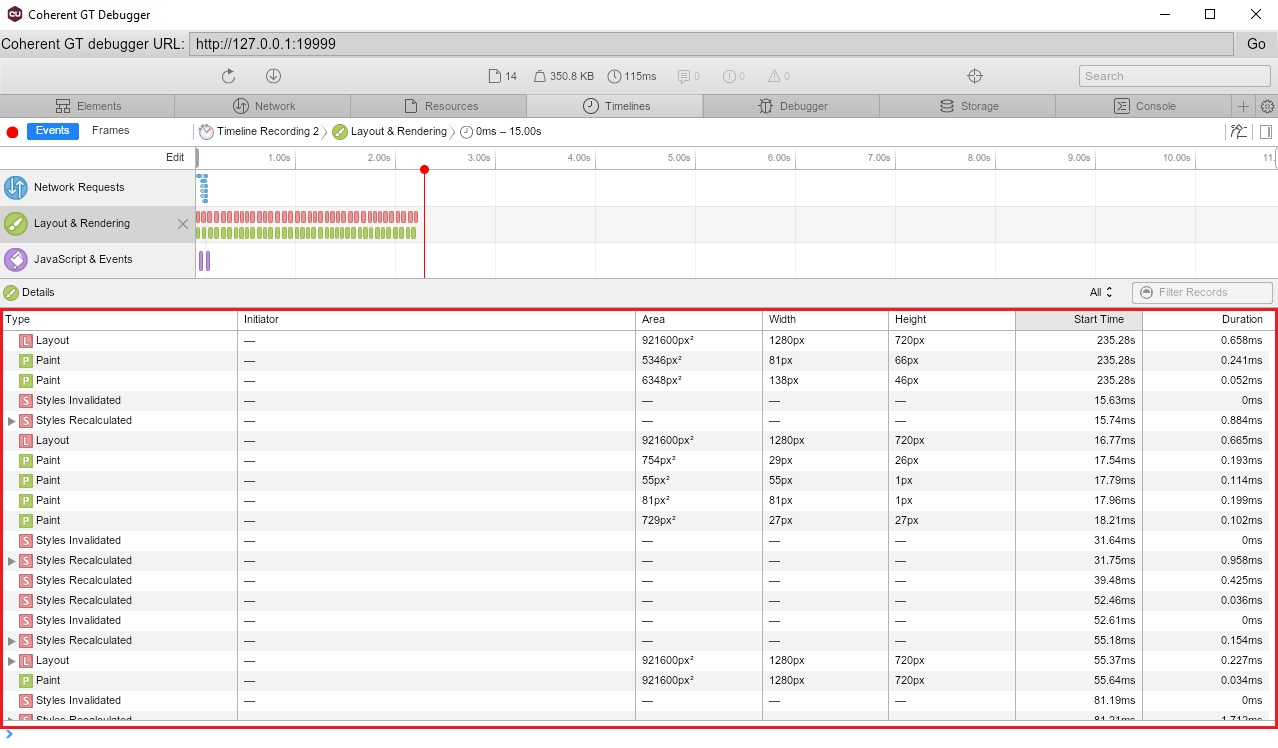
You can enable and disable each of the sections with the Edit button on the top. By clicking on the sections more details appear at the bottom of the Debugger (highlighted with red).
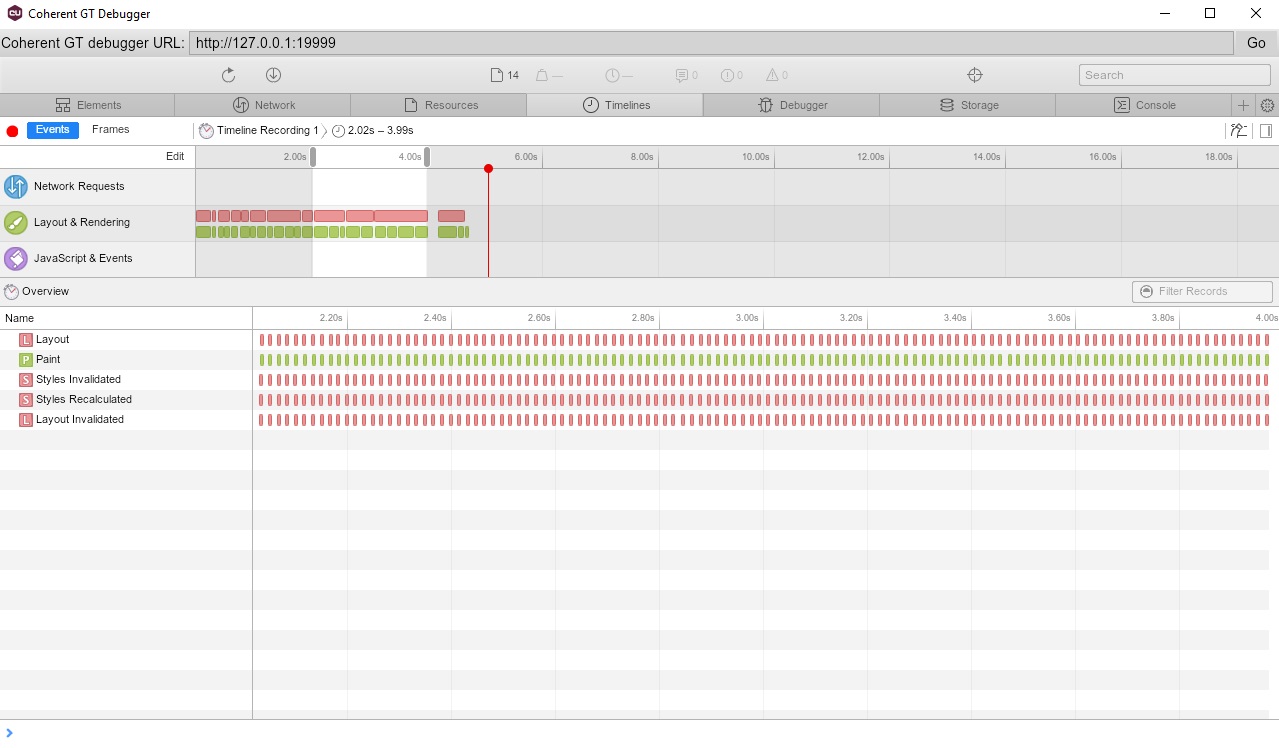
To make a recording of a page interaction, start the recording by pressing the Record button ![]() (the red dot under the Debugger’s navigation bar). Perform your page interactions, and then press the Record button again to stop the recording. You can zoom in on a section of a recording to make analysis easier.
(the red dot under the Debugger’s navigation bar). Perform your page interactions, and then press the Record button again to stop the recording. You can zoom in on a section of a recording to make analysis easier.
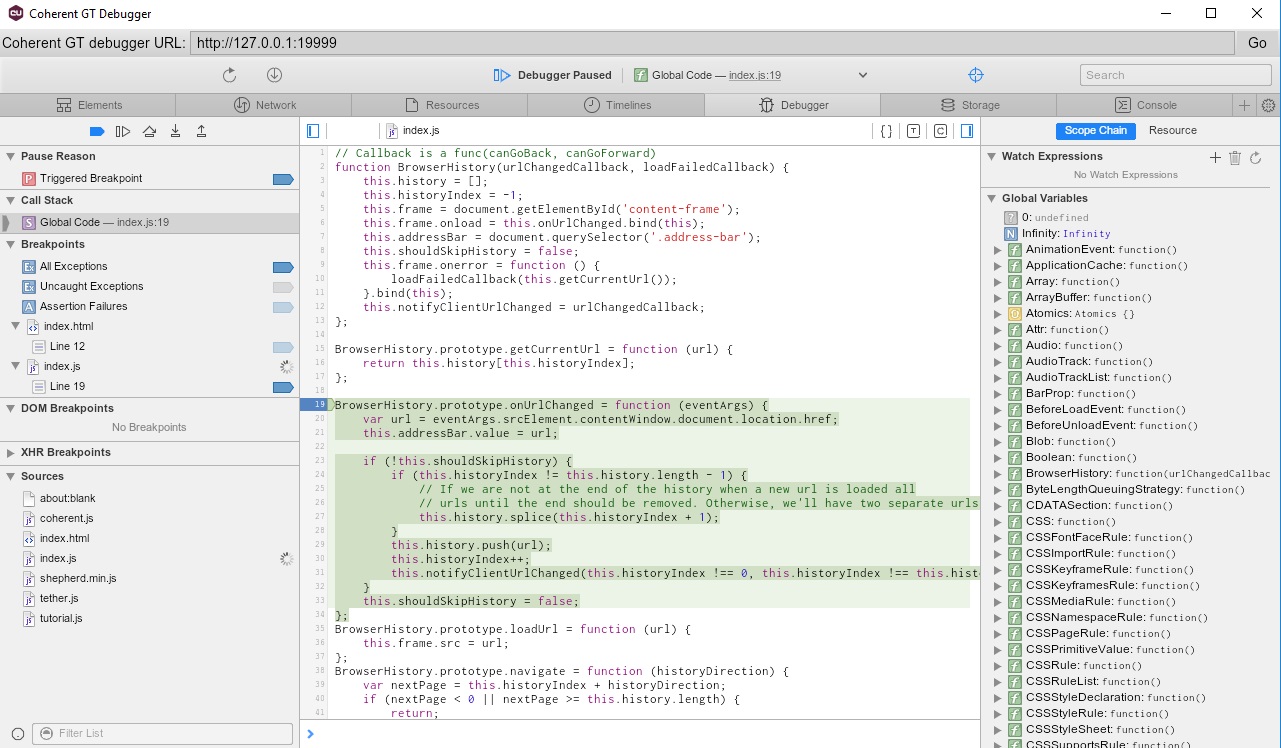
Debugger
This tab allows you to debug JavaScript by providing breakpoints, watches and ways to edit variables.
Storage
This tab enables you to inspect various types of storage that the application can use. Currently, it can be used to inspect the following storage types:
- Cookies: All the cookies created by the page or any iframes inside of the page. Cookies created as a part of response of network calls are also listed, but only for calls that happened while the tool is open.
- Local Storage: All local storage items created by the page or any iframes inside the page.
- Session Storage: All session storage items created by the page or any iframes inside the page.
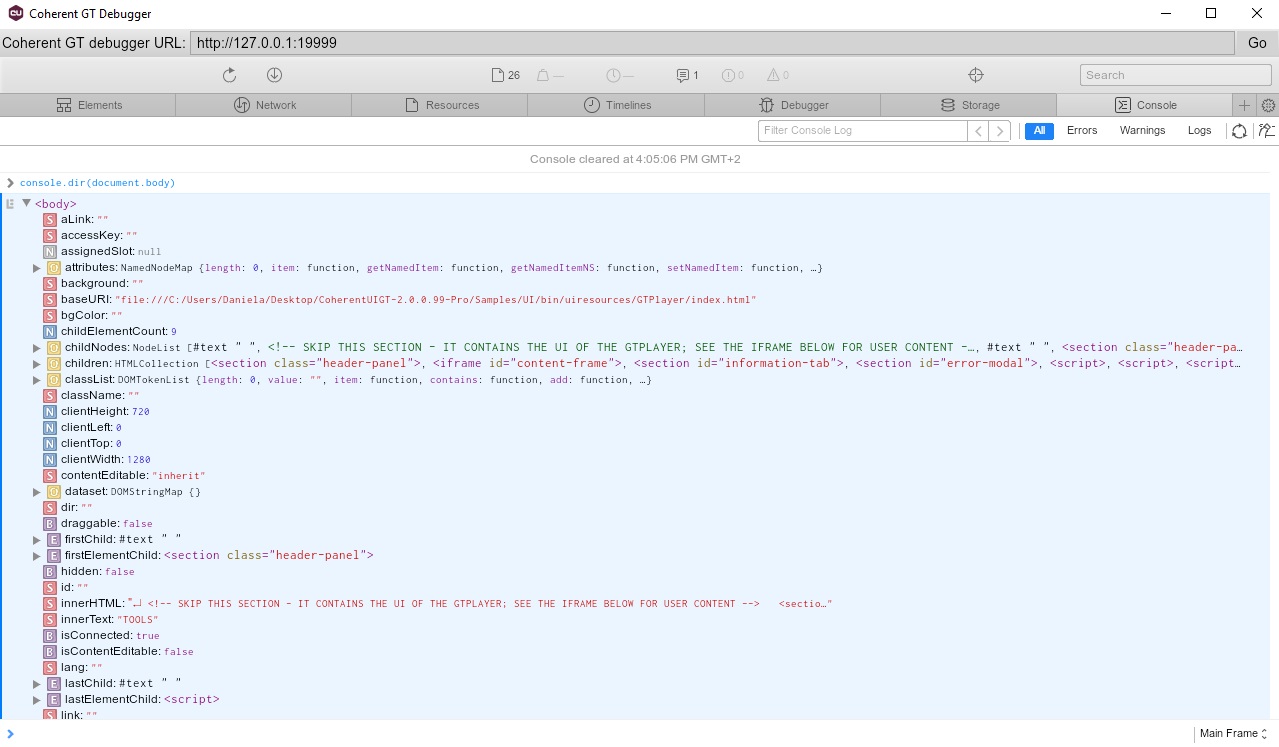
Console
The Console tab provides two primary functions for developers testing their code. It is a place to log diagnostic information in the development process (provided by the Console API) or a shell prompt which can be used to interact with the document.
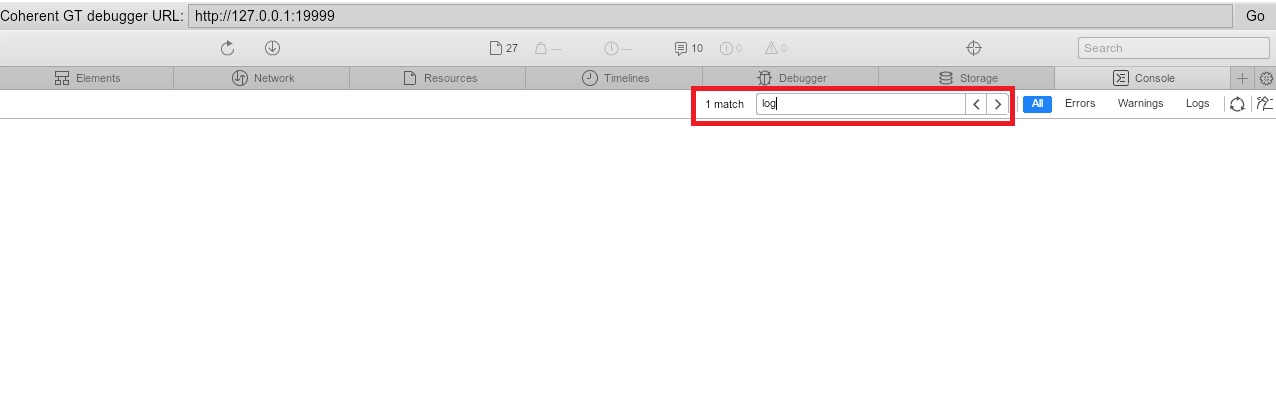
You can filter the console output from the input field under the navigation:
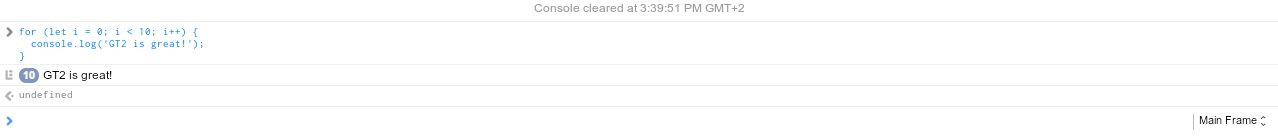
If a message is consecutively repeated, rather than printing out each instance of the message on a new line, the Console “stacks” the messages and shows a number in the left margin instead. The number indicates how many times the message was repeated.
GT’s Debugger will not only improve your workflow but help you to quickly discover the cause of an issue and fix it efficiently. We will continue to integrate and better the features of the Debugger into future versions of GT.