NOAA brings big climate data into your house with Coherent UI
We live in an age of information overload. You can find information about everything on the web. The important question, however, is how could you structure this information in a useful way, so you can benefit from it in your everyday life?
A team of specialists is working on bringing big climate data right into your house. We present you an amazing data visualization project developed by NOAA with Coherent UI. For those who are unfamiliar, NOAA is an abbreviation of National Oceanic and Atmospheric Administration of the US department of commerce.
We had the chance to speak to Eric Hackathorn from the research and development team of the NOAA Earth Information System project (NEIS) and to take a peek in the development of the project.
NEIS is a framework of services designed to help the discovery, access, understanding, and visualization of data from the past, present, and future. It includes a visualization component named TerraViz. The goal is to ingest “big data” and convert that information into efficient formats for real-time visualization. Designed for the world where everything is in motion, the system allows fluid data interaction across 4D time and space, providing a tool for exploring NOAA’s vast collection of information.
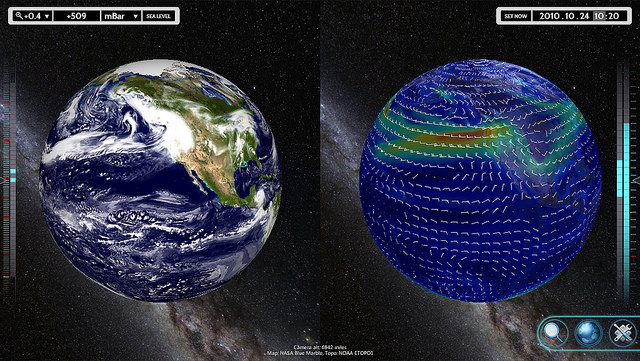
Synchronized Globes
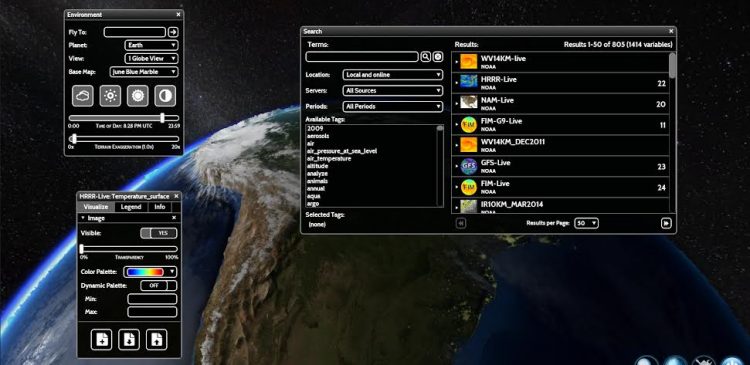
In TerraViz you can play with a 4D model of the Earth and choose between a variety of filters and data resources to find the information you are looking for. For example, you can track real time weather changes, view past data on seasonal variations or follow volcanic activity around the world.
Check out the video how TerraViz looks like:
Eric and his team started working on the project in 2010 and one of the big challenges they faced was how to render and display a huge load of information in an efficient user-friendly way. They decided to go with the gaming technology because it allows for high performance visualization. Moreover, it offers a familiar user experience, therefore, will help faster and easier adoption by a large group of people.
Although, the project will be available to professionals (scientists) who can use it for research, the main idea is to be an effective educational tool for students. NEIS goal and the main drive for Eric and his team is to create environmentally literate society.
“Part of NOAA’s mission is to create an environmentally literate society. However, to have an impact on society data should be easy to find, access, visualize, and understand. Game technologies provide a familiar platform to our target audiences for outreach and education.”
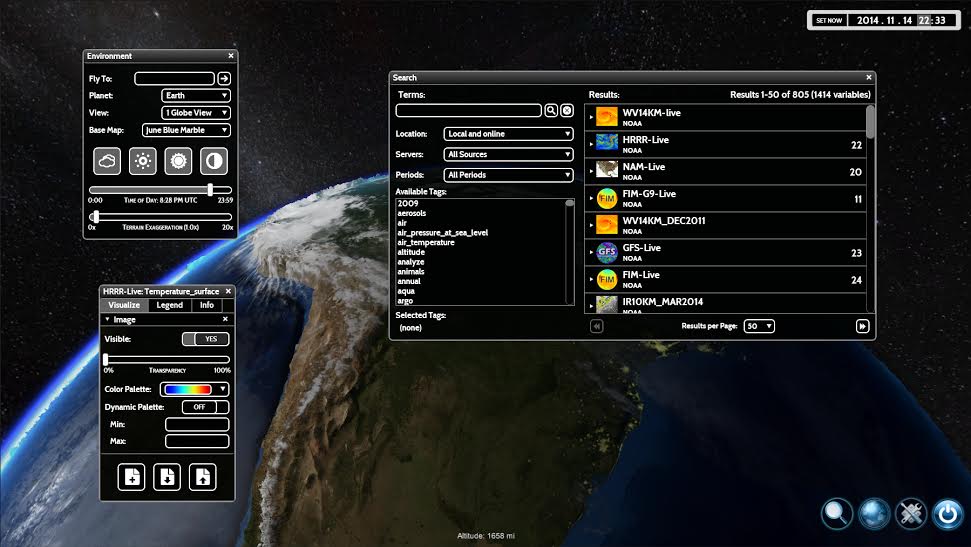
User Interface created with Coherent UI 2.5
Eric, also, shared with us why he believes Coherent UI is the best solution for the project:
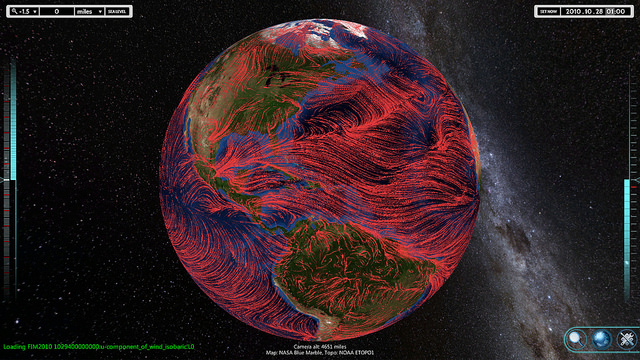
Flowing wind visualization from the FIM model
“Much of our existing infrastructure and code relies on using web services and standard javascript/HTML. Weather data has historically been served up through a web site. 🙂 Because of this it’s a lot easier to find development staff to program in standard web technologies than other UI solutions. By leveraging existing frameworks like jQuery we were able to create complex UI dialogs like the search screen or visualize 2D data using something like D3. This had previously proved very difficult using other UI technologies.”
Fingers crossed that next year TerraViz will be out for public use! We are excited to try it out ourselves. Eric shared with us that they are discussing other big data visualization projects and with the help of Coherent UI, they will be able to build interactive user-driven applications. Well, we are really proud that our tools enables researchers and developers to create educational and fun projects like TerraViz.